Before a Problem Occurs
-
Know what normal is (baseline):
- CPU usage
- Memory usage
- Traffic volume
- Traffic directions
- Protocols and port numbers
- Traffic pattern and distribution
-
Why?
- Abnormal behavior is difficult to identify, unless you know, relatively, what normal is
Network Diagrams
- Why?
- Explaining or analyzing complex networks is difficult and time consuming without them
- Physical diagrams:
- Include cables, ports, and physical network devices
- Show relationships at layer 1 and layer 2
- Logical diagrams:
- Include subnets, routers, logical devices
- Show relationships at layer 3
Monitoring Traffic Flows and Resource Usage
- Get normal data before problems or complaints
- Tools:
- Security fabric
- Dashboard with widgets
- SNMP
- Alert email
- Logging/syslog/FortiAnalyzer
- CLI debug commands
System Information
get system status
- We can tell if we have a physical or VM
- FortiGate-400E is physical
- Fortigate-VM64-KVM is VM
Network Layer Troubleshooting
execute ping-options ?

adaptive-ping
data-size
df-bit
interface
interval
pattern
repeat-count

execute ping x.x.x.x

execute traceroute x.x.x.x
Packet Sniffer and Debug Flow
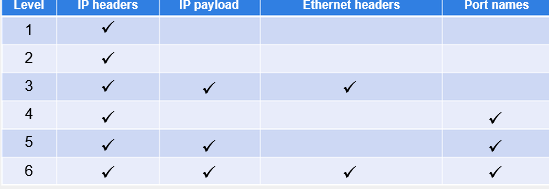
- Packet sniffer command:
diagnose sniffer packet <interface> <filter> <verbose> <count> <tsformat>
<count>stops packet capture after this many packets<tsformat>changes the time stamp formata- absolute UTC timel- Local time
Packet Sniffer Example
diagnose sniffer packet any 'host 8.8.8.8 and icmp' 4
- any to capture all interfaces
Packet Capture - GUI
- Network -> Diagnostics -> Packet Capture -> New Packet Capture
- Can be exported as a .pcap
Debug Flow
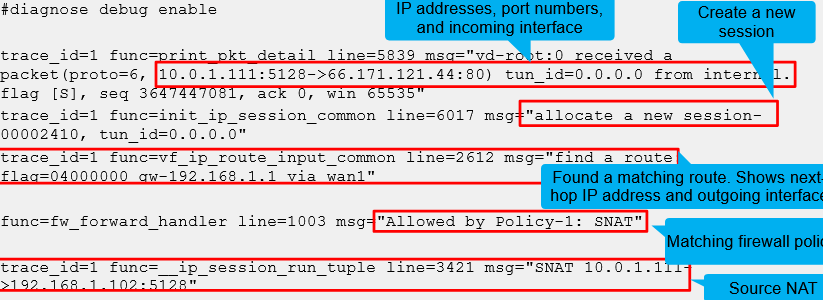
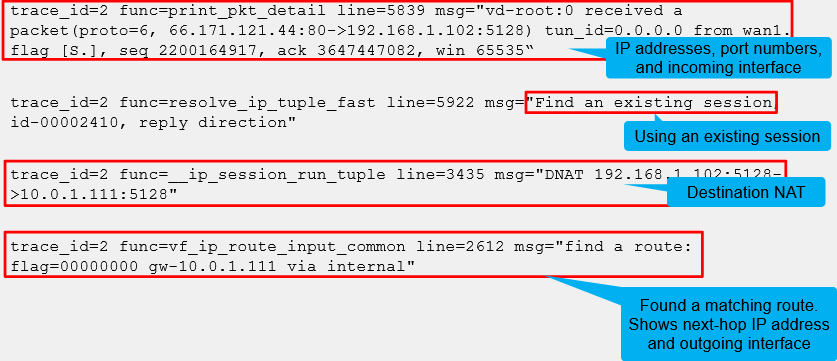
- Shows what the CPU is doing, step-by-step, with the packets
- If a packet is dropped, it shows the reason
- Multi-step command
- Define a filter:
diagnose debug flow filter <filter> - Enable debug output:
diagnose debug enable - Start the trace:
diagnose debug flow trace start <xxx> Repeat number - Stop the trace:
diagnose debug flow trace stop
Debug Flow Example - SYN
diagnose debug flow filter addr 66.171.121.44
diagnose debug flow filter port 80
diagnose debug flow trace start 20
diagnose debug enable
Debug Flow Example - SYN/ACK
Debug Flow - GUI
-
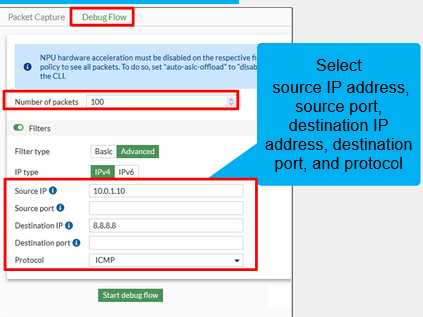
From the GUI:
- Network -> Diagnostics -> Debug Flow
- Network -> Diagnostics -> Debug Flow
-
Real-time analysis
- Embedded real-time analysis page
- Save and download the packet trace output as a CSV file
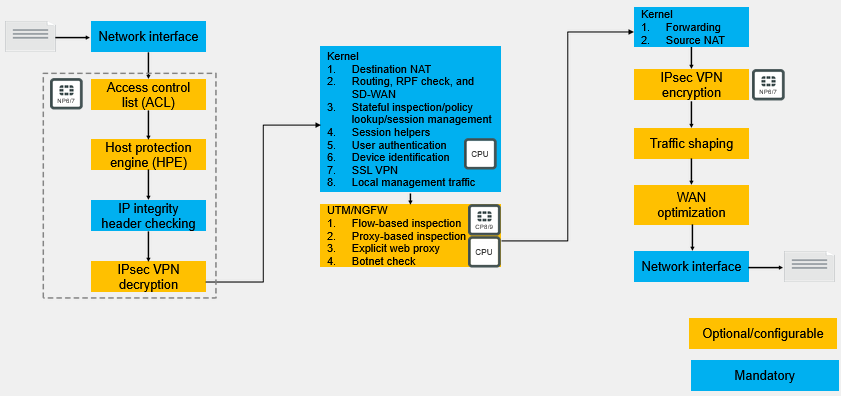
Life of a Packet - Initial Session Packets
Slowness
- High CPU usage
- High memory usage
- What was the last feature you enabled?
- Enable one at a time
- How high is the CPU usage? Why?
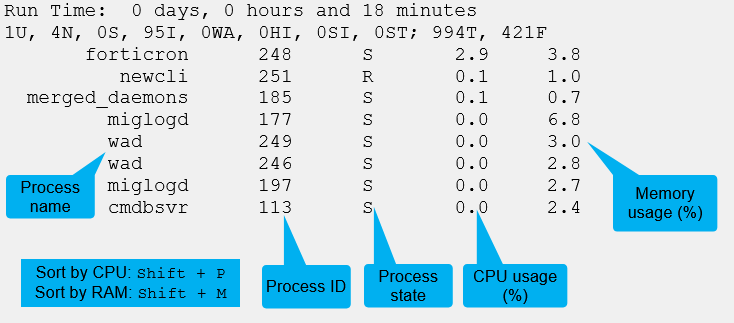
get system performance statusdiagnose sys top
High CPU and Memory Troubleshooting - Process Monitor
-
Processing monitor displays running processes
-
Each process shows CPU and memory usage
-
Can apply filters and sorting to fine-tune results
-
Allow terminating processes
-
Dashboard -> Status -> CPU or Memory -> Process monitor
High CPU and Memory Troubleshooting - CLI
diagnose sys top
Memory Conserve Mode
- FortiOS protects itself when memory usage is high
- It prevents using so much memory that FortiGate becomes unresponsive
- Three configurable thresholds:

config system global
	set memory-use-threshold-green <percentage>
	set memory-use-threshold-red <percentage>
	set memory-use-threshold-extreme <percentage>
end
What Happens During Conserve Mode?
- System configuration cannot be changed
- FortiGate skips quarantine actions (including FortiSandbox analysis)
- For packets that require any flow-based inspection by the IPS engine:
config isp global
	set fail-open [ enable | disable ]
end
-
enable: packets can still be transmitted without IPS scanning while in conserve mode
-
disable (default): packets are dropped for new incoming sessions
-
For traffic that requires any proxy-based inspection (and if memory usage has not exceeded the extreme threshold yet):
config system global
	set av-failopen [ off | pass | one-shot ]
end
-
Off: all new sessions with content scanning enabled are not passed
-
pass (default): all new sessions pass without inspection
-
one-shot: Similar to pass in that traffic is not inspected. However, it will keep bypassing the antivirus probe even after leaving conserve mode. Administrators must either change this setting, or restart the device, to restart the antivirus scanning
-
The
av-failopensetting also applies to flow-based antivirus inspection -
If memory usage exceeds the extreme threshold, all new sessions that require inspection (flow-based or proxy-based) are blocked
System Memory Conserve Mode Diagnostics
diagnose hardware sysinfo conserve
- Checks if device is in conserve mode
- on = yes, off = no
- Shows RAM total, used, freeable, etc.